Global    |     India
NEED HELP? WHATSAPP +91-7780427671
My Subscriptions | WaveOne Login
Wishlist
0 Compare
Menu
Login
  • Home
  • Pro Max SuiteHot
  • Sigma Suite
  • Concepts
    • Market Waves & Cloud
    • Volatility Meter
    • PTL Module
    • Sharks & Whales Volume Profile
    • Advanced Volume Analytics
    • Power Chart Module
    • WaveNodes Lens
  • Knowledge Base
  • WaveOne Membership
Click to enlarge
Home Analytics Modules Advanced Volume Analytics
WaveNodes Pro Max $99 / month
Back to products
Trap Alert Module $59 / month
Continuous Trading Directional Trading

Advanced Volume Analytics

$59 / month

AVA (Advanced Volume Analysis) is a powerful tool for analyzing volume data in the market, helping traders make informed trading decisions based on volume trends and patterns. It utilizes advanced algorithms to interpret volume data and identify potential trading opportunities.

Instruments Supported

Stocks, Commodities, Crypto

Market Conditions Supported

Continuous Trading, Directional Trading

Supports Options Trading

No

Recommended Timeframes

5 Min, 15 Min

Recommended For

Beginners, Intermediate traders, Professional traders

Supported Trading Types

Intraday (day trading), Swing trading

Get access to this product and more with WaveOne Membership.

Compare
Add to wishlist
Category: Analytics Modules Tags: Accumulation, AVA, Consolidation, Distribution, Hope Point, IVA, Last Hope Point, LHP, Target, Volume Analysis
  • Description
  • How To Use
Description

Elevate Your Trading with AVA (Advanced Volume Analytics)

Unlock the Power of Volume Data in Your Trading Strategy

Why Choose AVA?

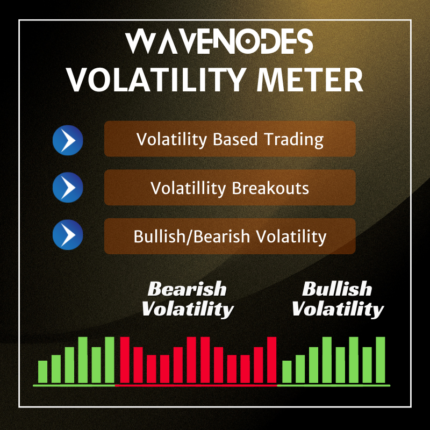
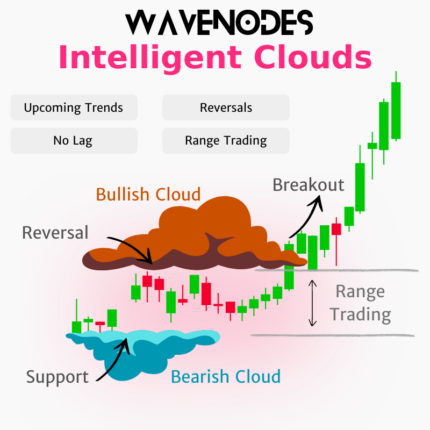
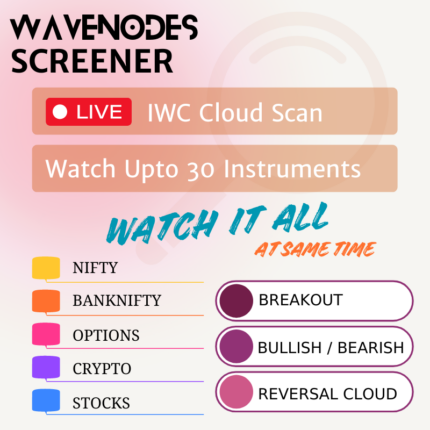
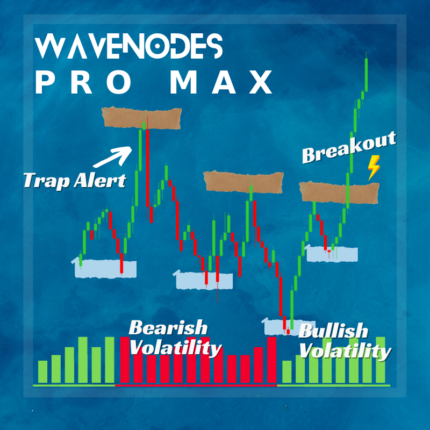
  • Advanced Volume Analysis: Utilize cutting-edge algorithms to analyze volume data and gain deep insights into market trends.
  • Enhanced Decision Making: Make informed trading decisions with confidence by incorporating volume analysis into your strategy.
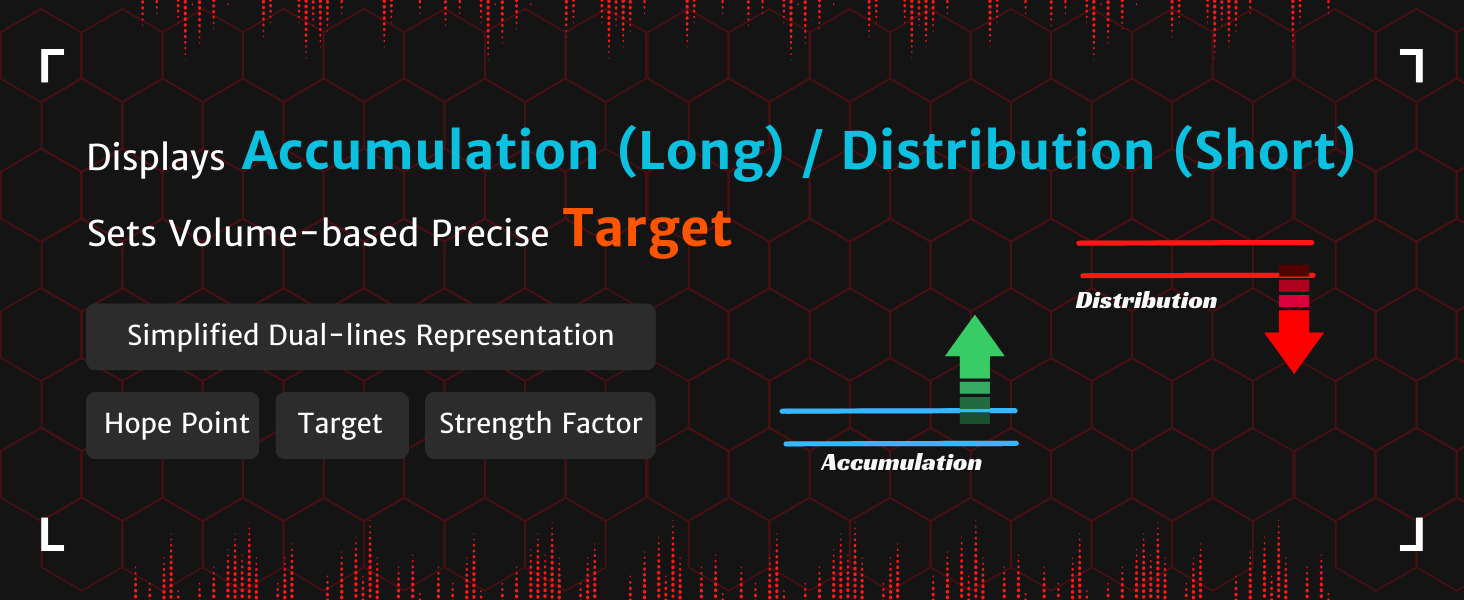
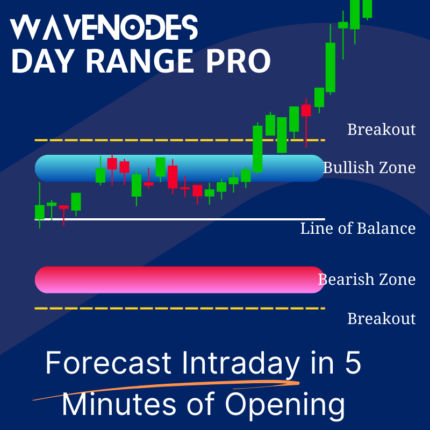
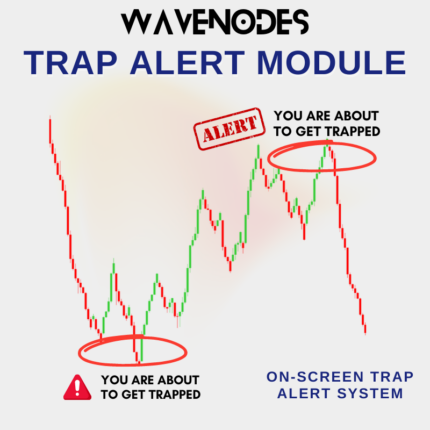
  • Accurate Signal Generation: Receive precise signals based on volume patterns, confirming price movements and enhancing trade reliability. Know when accumulation or distribution is completed and when trap activity is going on.
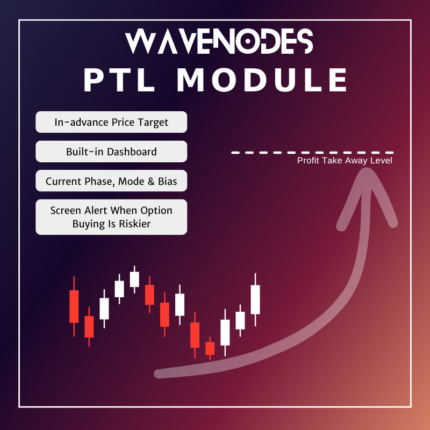
  • Volume-based Targets: Volume does not lie. When enough potential volume is picked by the big players, target is estimated based on volume invested.
  • Risk Management: Identify potential risks and opportunities with volume trends, empowering you to manage risk effectively.
  • Easy Integration: Seamlessly integrate AVA into your existing set-up for a hassle-free trading experience.

Experience the Difference in Your Trading Today with AVA!

How To Use

Applying WaveNodes Modules: A Step-by-Step Guide

  1. Visit TradingView.com: Go to tradingview.com in your web browser.
  2. Log In: Sign in to your TradingView account using your username and password.
  3. Open Any Chart: Once logged in, open any chart you'd like to analyze.
  4. Click on "Indicators": Look for the "Indicators" option located in the top bar above the chart.
  5. Navigate to Invite-only Scripts: Within the Indicators menu, find and select "Invite-only Scripts".
  6. Select Modules: From the list of available modules, choose the WaveNodes modules you wish to apply to the chart.
  7. Apply Modules: Click on the selected modules to apply them to your chart.


AVA Module - Advanced Volume Analytics

The AVA module assesses accumulation and distribution by investors and identifies the following levels:

Red levels in AVA parallel lines - Distribution is occurring. What to do? Either reduce the investment or take profits.

If the price is above the Red levels, there's a high likelihood of a trap or manipulated move; even the best moves can sometimes be traps.

Blue levels in AVA parallel lines - Accumulation is occurring. What to do? Either initiate an investment or increase exposure according to your risk appetite.

If the price is below the Blue levels, there's a high likelihood of a trap or manipulated move; even the best moves can sometimes be traps.

Last Hope Point (Short Length Red Dotted Line): This is the price point where big traders' algorithms are expected to shed investments. Consequently, it's the point below which a trader may witness a sharp price fall. Below the Last Hope Point, it's strongly recommended not to maintain any buy-side position and instead wait for accumulation to begin again or for the price to move above this level.

Target Price Point (Short Length Blue Dotted Line): This is the price level expected to be achieved after accumulation. A breakout above this line is considered a strong sign of another bullish wave forming.

Related products

Hot
Compare

WaveNodes Pro Max

Analytics Suites
$99 / month
Experience the next level of trading success with WaveNodes Pro Max Suite - the ultimate collection of analytical modules tailored for professional traders like you.
Add to wishlist
Add to cart
Quick view
Compare

Trap Alert Module

Analytics Modules
$59 / month
Trap Alert Module is your safeguard in trading. Get real-time on-screen alerts to avoid buyer and seller traps, manage risk, and maximize profits. Compatible with TradingView for seamless integration. Trade smarter today.
Add to wishlist
Add to cart
Quick view
Compare

Profit Target Level

Analytics Modules
$59 / month
A cutting-edge market analysis tool, equipped with Intelligent Wave Clouds and Price Channel features. Predict trends, identify entry and exit points, and seize lucrative opportunities with precision. Elevate your trading strategy with our advanced, user-friendly platform.
Add to wishlist
Add to cart
Quick view
Compare

Volatility Meter

Analytics Modules
$59 / month
Traders lose money because they use same strategy in every scenario. With volatility changes trading conditions and so does the strategy. Revolutionize your volatility trading game with WaveNodes Volatility Meter. Visualize volatility, track trends, and seize opportunities. Empower your decisions, start today.
Add to wishlist
Add to cart
Quick view
Hot
Compare

Intelligent Wave Clouds – IWC

Analytics Modules
$59 / month
A cutting-edge market analysis tool, equipped with Intelligent Wave Clouds and Price Channel features. Predict trends, identify entry and exit points, and seize lucrative opportunities with precision. Elevate your trading strategy with our advanced, user-friendly platform.
Add to wishlist
Add to cart
Quick view
Compare

Day Range Pro

Analytics Modules, Membership
Available with membership only
Unlock the power of precision trading with Day Range Pro – your indispensable tool for projecting intraday ranges and optimizing trading decisions.

Available with WaveOne Membership.

Add to wishlist
Add to cart
Quick view
Compare

WaveNodes Screener

Analytics Modules, Membership
Available with membership only
Experience live market mastery with WaveNodes Screener, your gateway to tracking multiple instruments live, all from a single, intuitive dashboard.

Available with WaveOne Membership Only.

Add to wishlist
Add to cart
Quick view

    Zero Setup Fee

    There is no setup or installation fee.

    Whatsapp Support.

    Whatsapp +91-7731810500 for support.

    Online Payment

    All payments are processed via reliable gateways

    Free Workshops

    Free Access to Workshops on Tools. Subject to T&C.

    • Trading Tools for
      • Beginners
      • Intermediate traders
      • Professional Traders
      • Investors
    • Tools By Trading Type
      • Intraday (Day Trading)
      • Swing Trading
      • Long term trading / investment
    • STOCK ANALYTICS
      • Price Action
      • Price Flow
      • Volume Analytics
      • Volatility Analytics
      • Options Trading
    • USEFUL LINKS
      • About Us
      • Community Disclaimer
      • Cookie Policy
      • License Agreement
      • Privacy Policy
      • Refund Policy
      • Risk Disclosure
      • Terms & Conditions
      • Contact Us

    AVAILABLE ON:

    app-store-button
    google-play-button

    Tradingview copyright and apps are owned by TradingView, Inc. WaveNodes is an independent firm and is not affiliated with or endorsed by TradingView, Inc.

    WAVENODES IS THE STOCK MARKET ANALYTICS TOOLS DEVELOPMENT FIRM THAT USES MODERN WAVE THEORY, FORECASTING MODELS, VOLATILITY AND TRAP DETECTION SYSTEM TO HELP INVESTORS MAKE TIMELY AND INFORMED DECISIONS. THE ANALYTICS SOFTWARE AND ITS MODULES ARE LICENSED BY WAVENODES TECHNOLOGIES AND ARE DELIVERED AS A SERVICE VIA TRADINGVIEW.COM.

    THERE IS A VERY HIGH DEGREE OF RISK INVOLVED IN TRADING. PAST PERFORMANCE IS NOT NECESSARILY INDICATIVE OF FUTURE RESULTS. WAVENODES, ITS OWNER WAVENODES TECHNOLOGIES, AND ALL INDIVIDUALS AFFILIATED (HEREON COLLECTIVELY REFERRED TO AS “THE COMPANY”) WITH THIS SITE ASSUME NO RESPONSIBILITY FOR YOUR TRADING AND INVESTMENT RESULTS. ALL THE MATERIAL CONTAINED HEREIN IS BELIEVED TO BE CORRECT, HOWEVER, THE COMPANY WILL NOT BE HELD RESPONSIBLE FOR ACCIDENTAL OVERSIGHTS, TYPOS, OR INCORRECT INFORMATION FROM SOURCES THAT GENERATE FUNDAMENTAL AND TECHNICAL INFORMATION. FUTURES AND FUTURES OPTIONS TRADING CARRIES SIGNIFICANT RISK. OPTIONS TRADING CARRIES SIGNIFICANT RISK. FOREIGN EXCHANGE TRADING CARRIES SIGNIFICANT RISK. STOCK TRADING CARRIES SIGNIFICANT RISK. TRADING SECURITIES, SECURITY OPTIONS, FUTURES AND/OR FUTURES OPTIONS IS NOT FOR EVERY INVESTOR, AND ONLY RISK CAPITAL SHOULD BE USED. YOU ARE RESPONSIBLE FOR UNDERSTANDING THE RISK INVOLVED WITH TRADING FUTURES, OPTIONS, STOCKS, AND FOREIGN EXCHANGE PRODUCTS. PRIOR TO TRADING ANY SECURITIES PRODUCTS, PLEASE READ THE CHARACTERISTICS AND RISKS OF STANDARDIZED OPTIONS AND THE RISK DISCLOSURE FOR FUTURES AND OPTIONS.

    THE INDICATORS, STRATEGIES, SETUPS, METHODS, AND ALL OTHER PRODUCTS AND FEATURES ON THIS WEBSITE ARE TO BE USED AS INPUT FOR INVESTOR’S OWN ANALYSIS PURPOSES ONLY AND SHOULD NOT BE CONSTRUED AS ADVICE. DATA AND INFORMATION FOR OBSERVATIONS ARE OBTAINED FROM SOURCES BELIEVED TO BE RELIABLE, BUT WE DO NOT WARRANT ITS COMPLETENESS OR ACCURACY OR CONTINUITY, OR WARRANT ANY RESULTS FROM THE USE OF THE INFORMATION. YOUR USE OF THE TRADING OBSERVATIONS IS ENTIRELY AT YOUR OWN RISK AND IT IS YOUR SOLE RESPONSIBILITY TO EVALUATE THE ACCURACY, COMPLETENESS, AND USEFULNESS OF THE INFORMATION.

    YOU MUST ASSESS THE RISK OF ANY TRADE WITH YOUR ADVISOR AND MAKE YOUR OWN INDEPENDENT DECISIONS REGARDING ANY SECURITIES MENTIONED HEREIN. AFFILIATES OF THE COMPANY MAY HAVE A POSITION OR AFFECT TRANSACTIONS IN THE SECURITIES DESCRIBED HEREIN (OR OPTIONS THEREON) AND/OR OTHERWISE EMPLOY TRADING STRATEGIES THAT MAY BE CONSISTENT OR INCONSISTENT WITH THE PROVIDED STRATEGIES. ALL OUR PARTNERS OR AFFILIATED COMPANIES ARE IN NO WAY ASSOCIATED WITH THE PROPRIETARY INFORMATION PROVIDED BY THE METHOD OR SOFTWARE OF THE COMPANY.

    RETURNS SHOWN MAY INCLUDE THAT FOR LONG, SHORT, OR BOTH SIDES DO NOT INCLUDE OTHER FEE AND COMMISSION COSTS. SHORT TRADES ARE EXTREMELY HIGH RIGH TRADES UNLESS USED FOR HEDGING PURPOSE. ALL PROJECTIONS ARE BASED ON CURRENT RETURNS. THE PROJECTIONS DO NOT ACCOUNT FOR ANY POSSIBLE DRAW DOWN EFFECTS ON PERFORMANCE AND PERFORMANCE PROJECTIONS. ACTUAL RETURNS AND PROJECTED RETURNS MAY FLUCTUATE OVER THE COURSE OF THE SERVICE.

    ANY PERSON WHO CHOOSES TO USE THIS INFORMATION AS A BASIS FOR THEIR TRADING ASSUMES ALL THE LIABILITY AND RISK FOR THEMSELVES AND HEREBY AND ABSOLUTELY AGREES TO INDEMNIFY AND HOLD HARMLESS NINJACATORS, LLC, ITS PRINCIPALS, AGENTS, AND EMPLOYEES.

    TESTIMONIALS DISCLAIMER: TESTIMONIALS APPEARING ON THIS WEBSITE AND OR ALL LINKED OR AFFILIATED WEBSITES MAY NOT BE REPRESENTATIVE OF THE EXPERIENCE OF OTHER CLIENTS, USERS, CUSTOMERS AND IS NOT A GUARANTEE OF FUTURE PERFORMANCE OR SUCCESS.

    WAVENODES IS THE BRAND NAME AND REGISTERED TRADEMARK OF WAVENODES TECHNOLOGIES THAT OWNS ALL RIGHTS OF METHODS USED IN THE ANALYTICAL TOOLS OFFERED ON THIS WEBSITE OR THROUGH AFFILIATE WEBSITES. THE TOOLS USE PROPERITARY METHOD AND CONTENT THAT ARE OWNED BY WAVENODES TECHNOLOGIES. THESE ARE FOR PERSONAL USE OF THE BUYER. COMMERCIAL UNIT MUST OBTAIN LICENSE TO USE THESE TOOLS FOR MULTI-CLIENT SERVICE OR FOR COMMERCIAL INVESTMENTS.

    [FOR US BASED CLIENTS] CFTC RULES 4.41 – HYPOTHETICAL OR SIMULATED PERFORMANCE RESULTS HAVE CERTAIN LIMITATIONS; UNLIKE AN ACTUAL PERFORMANCE RECORD, SIMULATED RESULTS DO NOT REPRESENT ACTUAL TRADING. ALSO, SINCE THE TRADES HAVE NOT BEEN EXECUTED, THE RESULTS MAY HAVE UNDER- OR OVER-COMPENSATED FOR THE IMPACT, IF ANY, OF CERTAIN MARKET FACTORS, SUCH AS LACK OF LIQUIDITY. SIMULATED TRADING PROGRAMS IN GENERAL ARE ALSO SUBJECT TO THE FACT THAT THEY ARE DESIGNED WITH THE BENEFIT OF HINDSIGHT. NO REPRESENTATION IS BEING MADE THAT ANY ACCOUNT WILL OR IS LIKELY TO ACHIEVE PROFIT OR LOSSES LIKE THOSE SHOWN.

    Payment System:

    Our Social Links:

    Copyright 2024 WaveNodes Technologies. All Rights Reserved.
    • Menu
    • Categories
    • Analytics Suites
      • WaveNodes Pro Max
      • WaveNodes Sigma
    • Analytics Modules
      • Advanced Volume Analytics
      • Day Range Pro
      • Intelligent Wave Clouds – IWC
      • Profit Target Level
      • Sharks & Whales Volume Profile
      • Smart Order Blocks
      • Trap Alert Module
      • Volatility Meter
      • WaveNodes Screener
    • WaveOne Membership
    • Members Only Products
      • Smart Order Blocks
      • Day Range Pro
      • WaveNodes Screener
    • Learning Modules
      • Master Hedging Technique
      • Decisive Options Trading with OODA Loop
    • Home
    • Shop
      • Analytics Modules
      • Analytics Suites
      • Membership
    • Knowledge Hub
    • Videos Hub
    • About Us
    • Contact us
    • Wishlist
    Wavenodes Logo

    Visiting from India 🇮🇳? Click here to go to in.wavenodes.com

    Continue with www.wavenodes.com

    Chat with us